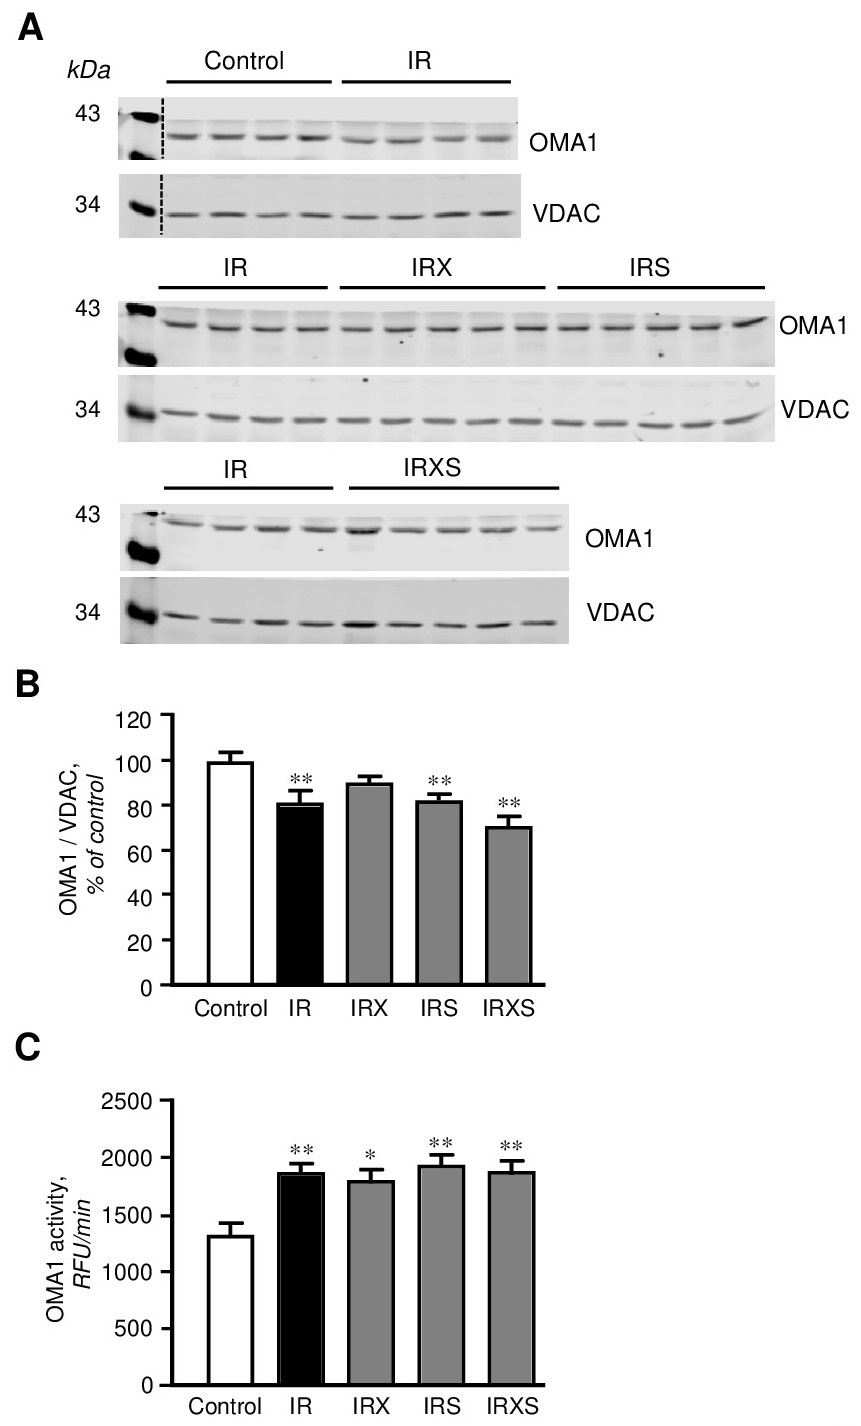
Fig. 6. Protein levels and activity of OMA1. A, Representative immunoblots of OMA1 in mitochondria isolated from control and IR hearts. Mitochondrial samples were run on 3 different gels in the following order: top blot: control and IR (n=4 per group); middle blot: IR, IRX, and IRS (n=4 for IR, n=5 for IRX and IRS); bottom blot: IR and IRXS (n=4 for IR, n=5 for IRX and IRXS). Mitochondrial samples from the same individual IR hearts were run in all 3 gels. OMA1 samples were normalized to VDAC expression for each band, and mean values were presented as a percent of control. B, Quantitative data of OMA1 protein levels. C, The enzymatic activity of OMA1. OMA1 protein levels were calculated based on densitometry analysis using LI-COR Image Studio Lite and normalized to VDAC, a mitochondrial housekeeping protein. OMA1 activity was measured for 30 min at 37∘C by spectrofluorometer at excitation/emission of 320/405 nm. RFU, relative fluorescence units. Groups: Con, control; IR, ischemia-reperfusion; IRX, IR+XJB; IRS, IR+SfA; IRXS, IR+XJB+SfA. *P<0.05, **P<0.01 vs. Con. n=4-5 for OMA1 protein expression studies (B) and n=4-6 for OMA1 assay (C), per each group.